Underlying Data
All 38 food items with their carbon footprint and nutritional values per 100g. Data sourced from USDA Food Data Central and Our World in Data emissions research.
| Food Item | Category | CO₂eq (kg) | Calories | Protein (g) | Carbs (g) | Fat (g) |
|---|
Visualization 1
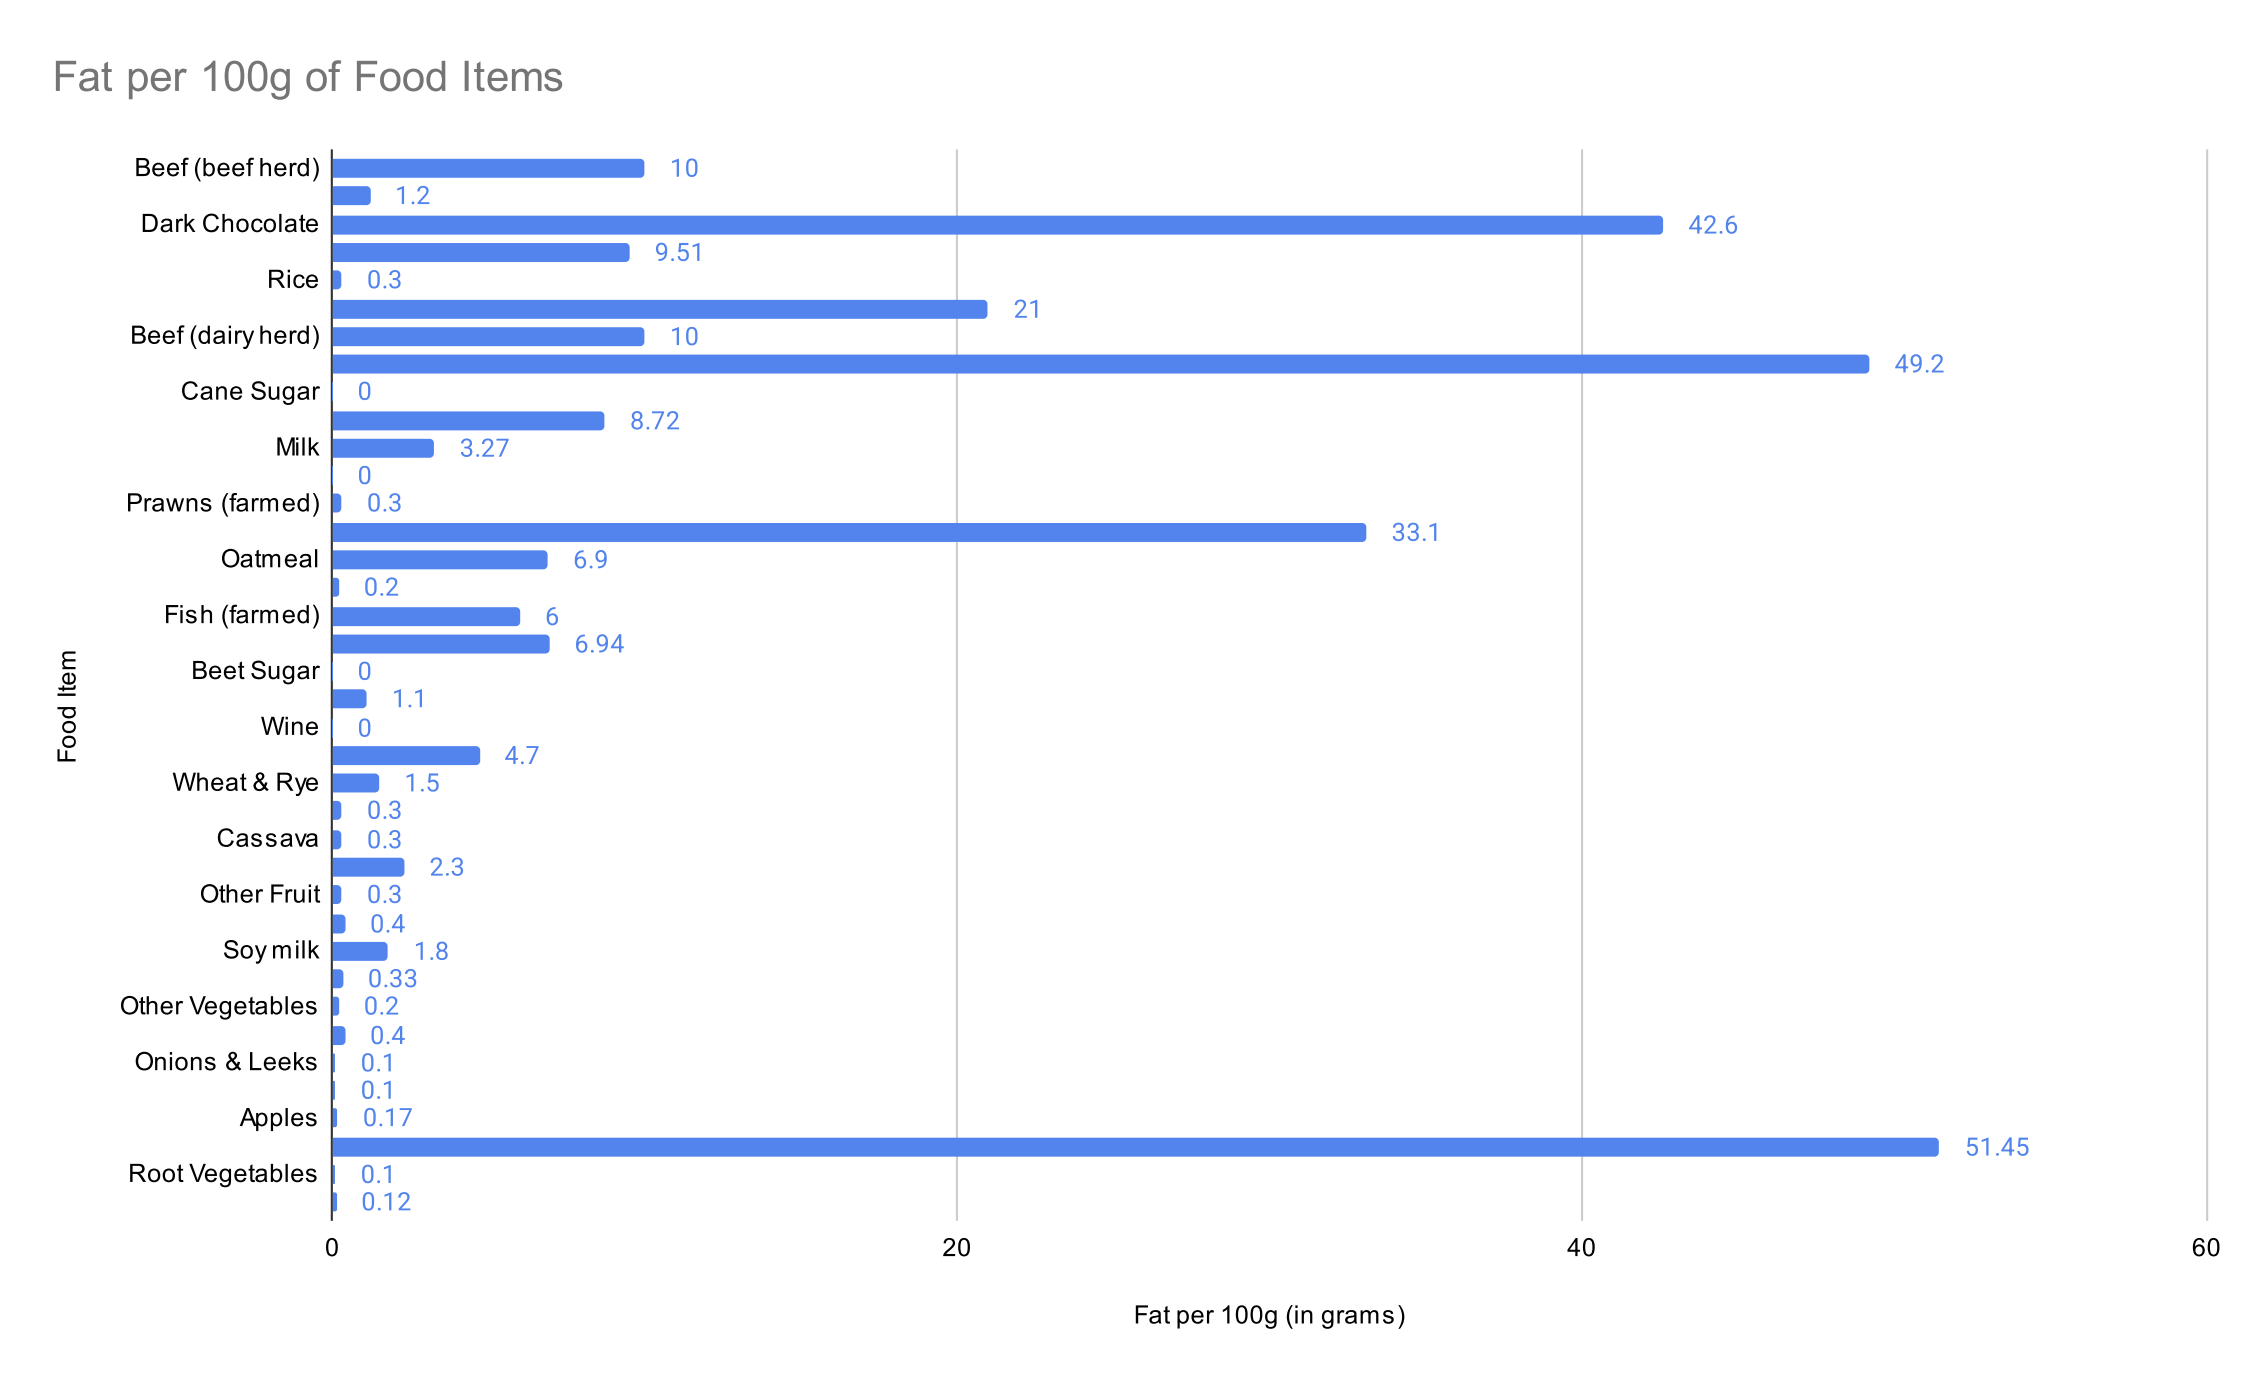
Fat per 100g of Food Items
A horizontal bar chart comparing fat content across all food items. Nuts and groundnuts stand out as the highest fat foods, while most vegetables, fruits, and grains contain minimal fat.
Visualization 2
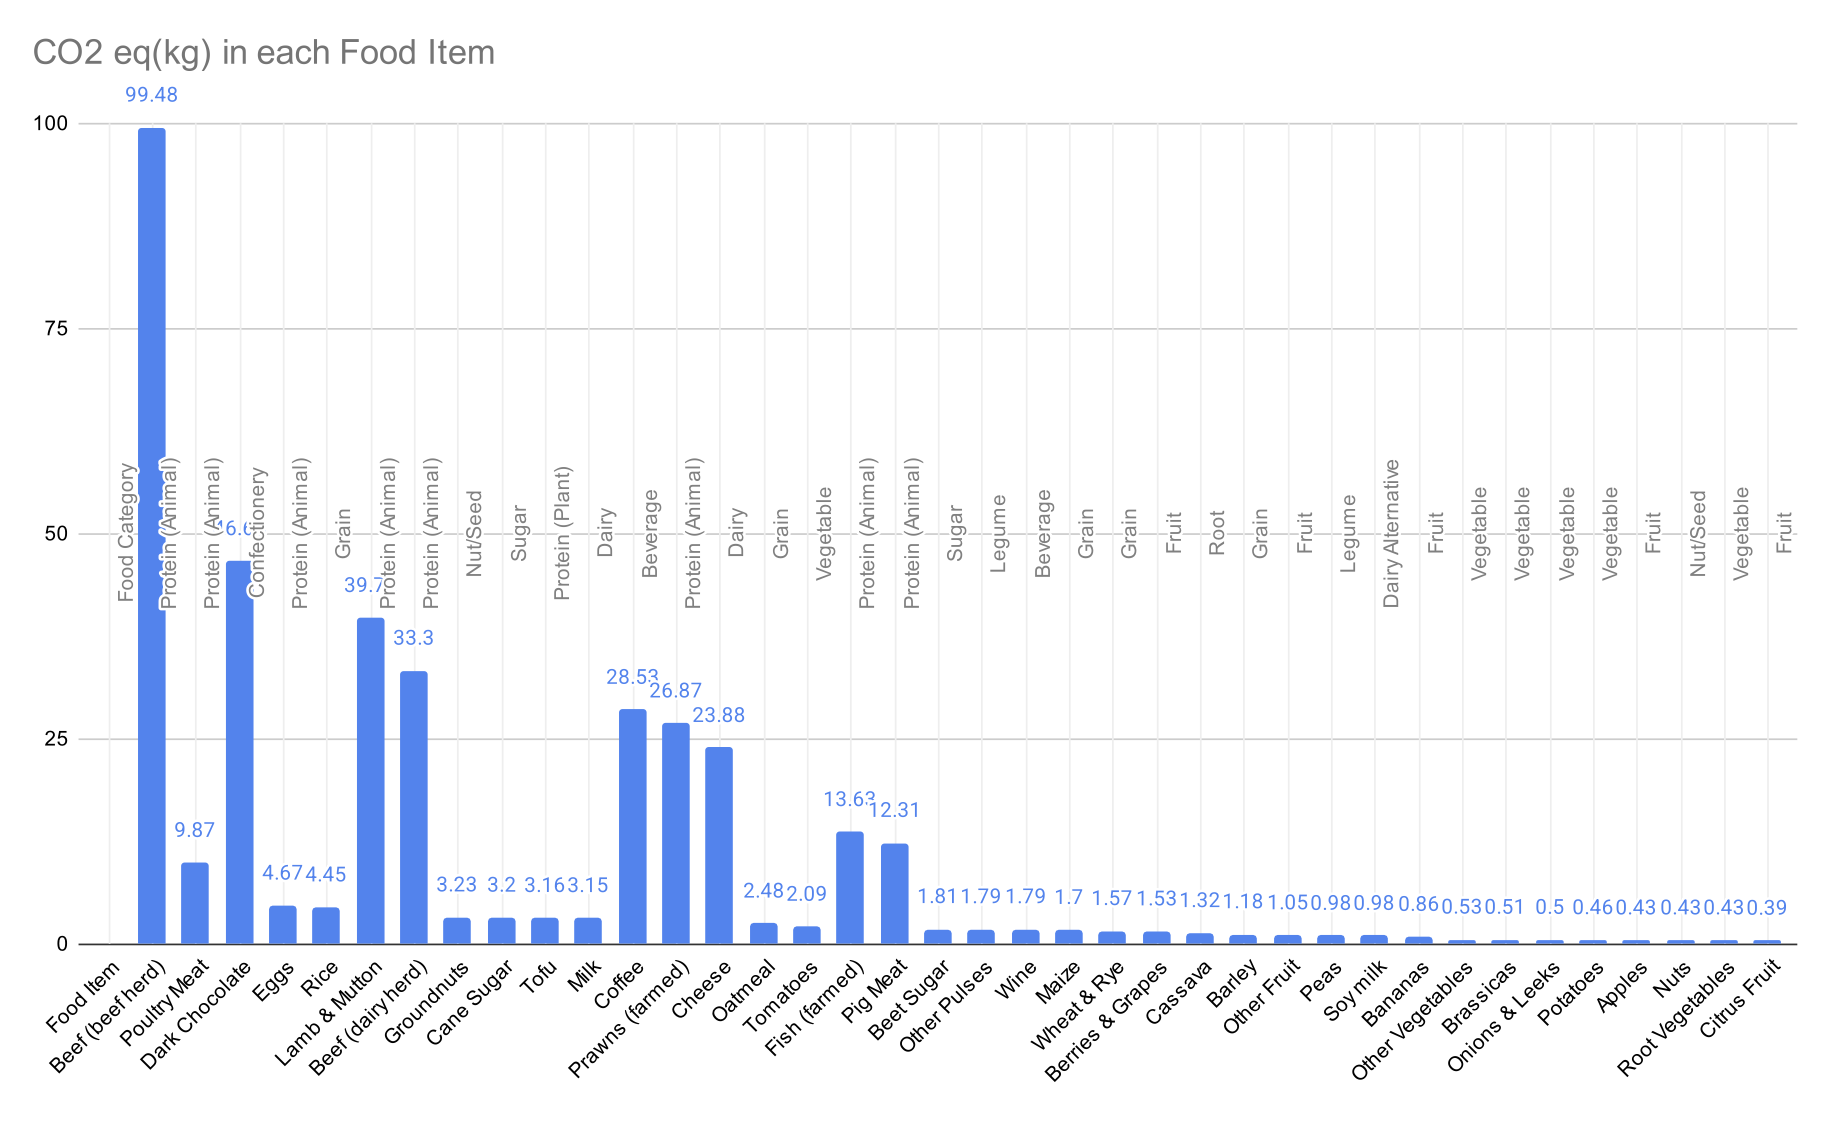
CO₂ Equivalent (kg) per Food Item
A horizontal column chart showing the carbon footprint for all 38 items. Beef from the beef herd dominates at nearly 100 kg CO₂eq, roughly 10× higher than the next highest items, illustrating the outsized climate impact of ruminant meat production.
Key Insights
What the data tells us
231×
Beef emits 231× more CO₂eq per kg than potatoes, the most widely consumed staple vegetable in the dataset.
Top 5
The 5 highest-emission foods — beef, lamb, coffee, cheese, and prawns — are all animal products or heavily processed goods.
3% cost
Groundnuts deliver nearly as much protein as beef (25.8g vs 20g) at just 3% of beef's carbon footprint.